After my little stint of research, I set about putting the theory into practice. Before I go into it, here is a video of detection working (warning, contains bodily fluids).
Warning, this video contains bodily fluids.
Fluids in order: water, lube, salt water, urine, semen.
My laptop keyboard still has suspicious fluids on it…
Please note the above video is a best case scenario and a lot of testing is still required!
My first attempt was to just pass 5v into various samples and see what they did. I used the #2 digital output pin on the Arduino to control whether or not any power was sent to the sample and a 10 kΩ shunt resistor so I could measure the current across the sample by reading the A0 analog in for the Arduino. I measured the current once every 10 ms for 2 seconds, then rested the sample for 2 seconds.
The results were encouraging.
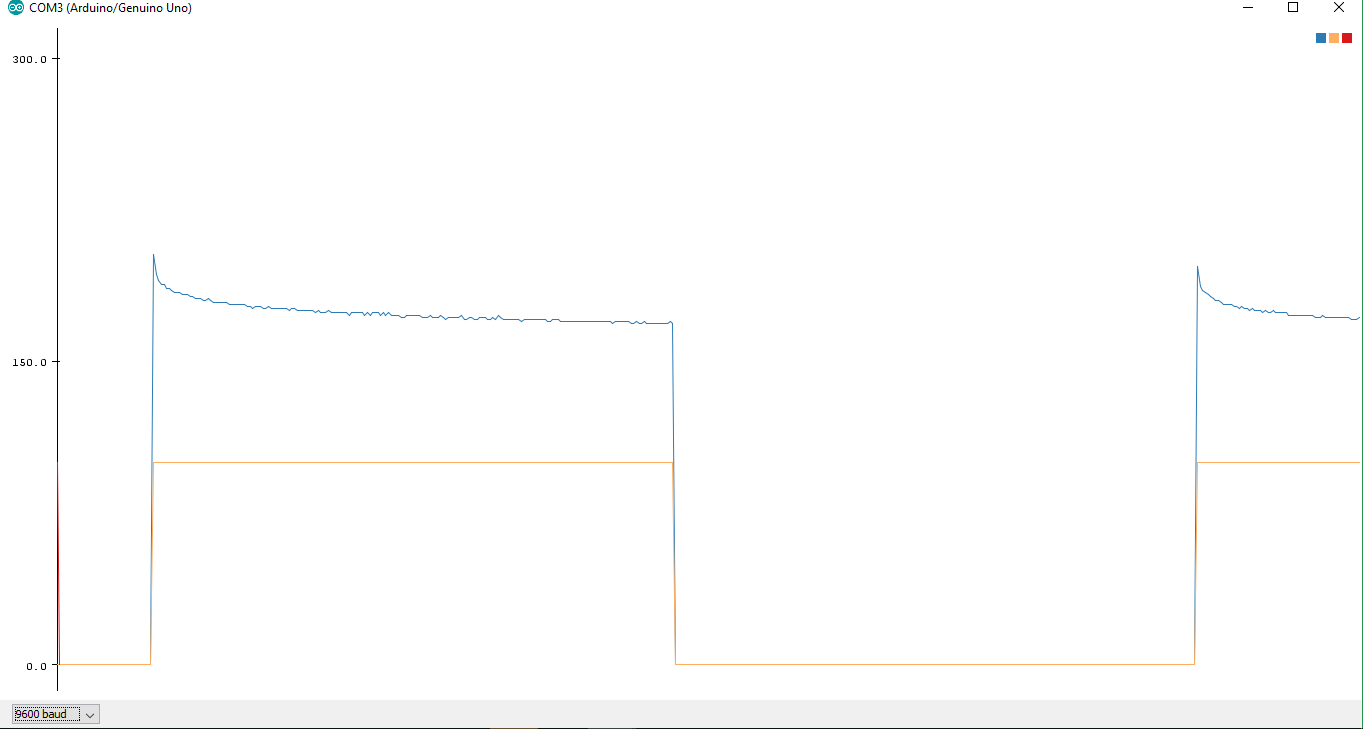
The graph below shows one round of stimulation of a sample of water, the orange line represents voltage in (5v) and the blue line is the current measurement. You can see I rest the sample between trials for 2 seconds (important).

The following shows the change in current measured in a sample of cum.
So, there’s definitely something happening, the current across the sample is changing for the duration of the stimulation (2 seconds), but how to get a more meaningful comparison? I knew that I needed at least 1.23 v to electrolise water into into oxygen and hydrogen, but I didn’t want to use much more than that. I used a simple voltage divider made from two 22 k Ω resistors, resulting in something close to 1.8 v across the sample, which seemed to work OK.

After taking many samples and calculating an average for each sample, I could say with confidence that on average, a 2 second stimulation of the various samples looks like this:

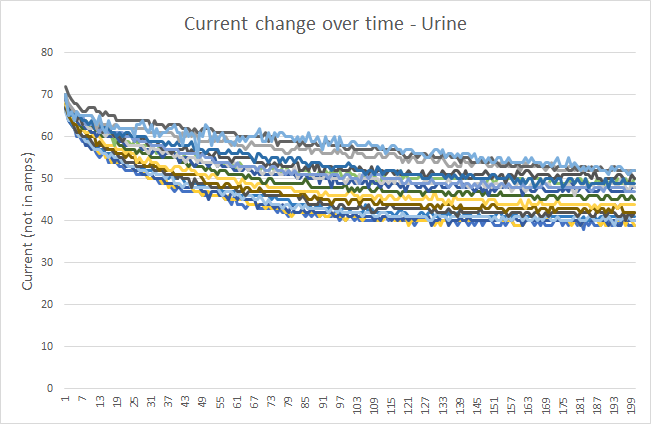
Now, it looks pretty cut & dry: cum has on average a much much lower final current after 2 seconds. Why not just measure the current value after 2 seconds of stimulation and if it’s below a threshold (say 35 in the example above), then it’s cum? Well, the problem is that this is an average, the real data is a whole lot messier:

The fact that cum has a very distinctive “shape” on the average graph gave me the encouragement to try harder to untangle signal from the noise.
To overcome the variability in the data I did two things: firstly I took a 5 point moving average for all points, to smooth them out a little. I then expressed every set of 5 points as a ratio of the first 5 points. So, to get the value for point 8, I would calculate Average(Points(8-12))/Average(Points(1-5)), which is actually the same as Sum(Points(8-12))/Sum(Points(1-5)).
This resulted in the following graph (once again, taken as an average):

That’s all very well, but this is still an average, how do we handle the fact that each trial (each time I stimulate a sample) may have variability to it? Looking at the minimum and maximums rather than the averages, we get this:
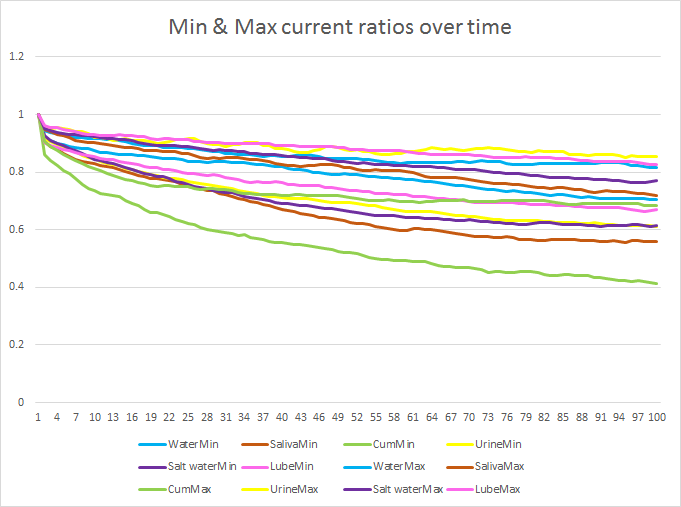
If you look carefully, you can see at about 10 or 15 (between 100 and 150 ms), there’s a promising gap between all other minimums and the maximum value for cum. I focused my attention on this ratio.
So, that’s it right? If the ratio between the first 5 points and points 10-15 is less than 0.8, we have cum! Well, yes and no. As I said before, by passing a current through the sample, we are actually changing it, so we need to consider how the nature of the sample changes over time. Also, I wanted to speed up the time taken to get a result, up until now, I was stimulating for 2 seconds and resting for 2 seconds, that was quite slow for the detection I wanted.
So, I sped it up, this time allowing the sample to rest only 100 ms and stimulating for only 200. I then recorded the ratio and plotted it over time. So, the graph below is showing many hundreds of trials (a cycle of stimulation and rest for the sample), where the x-axis is the trial number.
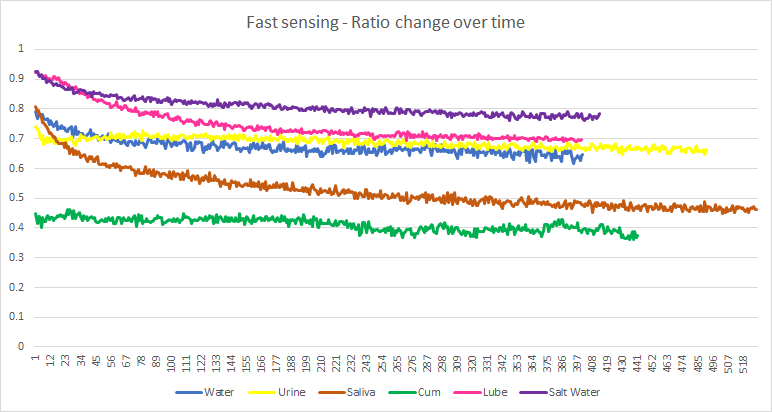
Saliva appears to be quite unstable over time. All other samples I used appear to stabilise well above the ratio for cum. Saliva, however, comes dangerously close. To be fair, I don’t mind so much if I get false positives on saliva since I am not expecting saliva to find it’s way inside the masturbator toy.
I am still worried that the samples do change a fair bit over time, making stable readings difficult. I also note that my simple copper electrodes may not be good enough. The positive electrode slowly builds up a black layer of oxidation, probably from the electrolysis.
Simple code for the detector is here: voltammetry2.sdf.ino
One thought on “Detecting cum with voltammetry”